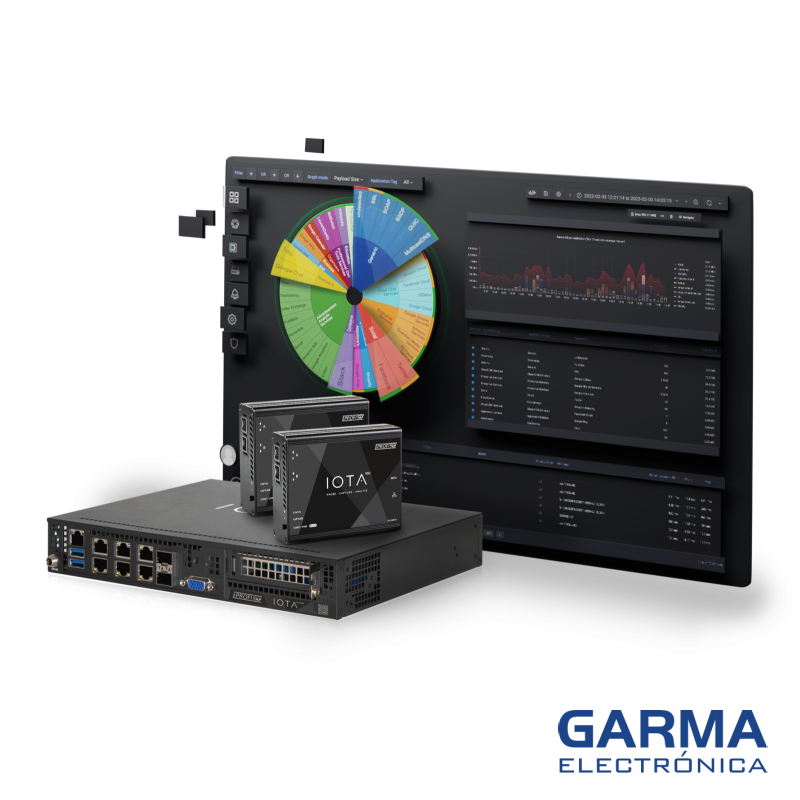


Profitap IOTA EDGE is a family of compact devices for capturing, monitoring and analysing Ethernet traffic in industrial IT/OT networks. It combines Network TAP functionality, SSD storage and analysis tools accessible through a web interface.
.svg)
Política de entrega (editar con el módulo de Información de seguridad y confianza para el cliente)
In industrial networks, many communication problems occur intermittently: devices lose connectivity, responses are delayed, links become congested or unusual behaviour disappears before a maintenance technician can investigate.
IOTA EDGE records traffic at strategic points in the network so that events can be analysed afterwards, without requiring a capture computer to remain connected continuously.
The range includes Gigabit Ethernet models with RJ45 interfaces and 10 GbE versions with SFP+ interfaces, as well as variants with GPS/PPS synchronisation for correlating captures taken at different points in an installation.
Device selection mainly depends on link speed, connection type, storage capacity and timing synchronisation requirements.
| Feature | IOTA 1G | IOTA 1G+ | IOTA 10G | IOTA 10G+ |
|---|---|---|---|---|
| Capture interfaces | 2 RJ45 | 2 RJ45 | 2 SFP+ | 2 SFP+ |
| Ethernet speeds | 10/100/1000 Mbps | 10/100/1000 Mbps | 1/10 Gbps | 1/10 Gbps |
| In-line capture | Yes | Yes | Yes | Yes |
| Dual SPAN | Yes | Yes | Yes | Yes |
| SSD storage | 1 TB | 1 or 2 TB removable | 1 TB | 1 or 2 TB removable |
| Hardware timestamping | 8 ns | 8 ns | 8 ns at 1G / 6.4 ns at 10G | 8 ns at 1G / 6.4 ns at 10G |
| NTP synchronisation | Yes | Yes | Yes | Yes |
| GPS/PPS connections | No | Yes | No | Yes |
| PoE+ power via the management port | No | Yes | No | Yes |
| Bypass on power failure | Active bypass | Active bypass | No | No |
| Management port | Gigabit RJ45 | Gigabit RJ45 | Gigabit RJ45 | Gigabit RJ45 |
Power supply and storage options depend on the variant. SFP+ 10G models do not provide bypass on power loss. Actual capture duration depends on traffic volume and device configuration.
For industrial installations using M12 Ethernet connections, Profitap offers an IOTA 1G variant with two female X-coded M12 connectors instead of the RJ45 ports on the standard model.
This version includes 2 TB of SSD storage, compared with 1 TB on the RJ45 IOTA 1G, and retains the Gigabit Ethernet traffic capture and analysis functions of the range.
The choice between RJ45 and M12 depends on connection type and installation conditions.
The Overview dashboard provides an initial view of recorded traffic: which devices communicate, how much traffic they exchange and how network activity changes over time.
Its communication diagram identifies the most active devices and shows the relationships between different IP addresses. Selecting an address applies a filter to focus on the associated communications.

Bandwidth and new-flow charts help locate periods of unusual activity. A specific time interval can be selected for more detailed analysis.
Industrial application: when an intermittent incident occurs, the technician can review traffic from the affected period, identify the devices involved and determine which communications require further investigation.
The Application Overview dashboard complements the information in the Overview dashboard.
While the latter shows which devices communicate, this dashboard examines which applications and services are involved in those communications.
Traffic is organised by application type and identified applications. Charts provide metrics such as latency, flow count and the volume of transmitted data.

This information helps locate services consuming substantial bandwidth, identify unexpected communications and detect potential application performance problems.
Industrial application: in an infrastructure combining supervisory systems, engineering workstations, servers and industrial devices, this dashboard helps explain how traffic is distributed between applications and select the communications worth investigating.
Occasional communication losses between PLCs, HMIs, SCADA systems and other Ethernet-connected devices can be difficult to reproduce.
IOTA EDGE records traffic at a point in the network so that communications from the incident period can be reviewed afterwards. This supports the investigation of communication errors, failed connections and unexpected changes in traffic behaviour.
In installations using Modbus TCP, the dedicated IOTA dashboard shows message distribution over time and the clients and servers involved in communications.
For other industrial protocols, such as PROFINET RT, PROFINET IRT or TSN technologies, a distinction must be made between Ethernet frame capture and the availability of specific decoding and analysis functions. The latter require additional validation for the protocol and type of investigation.
Bandwidth, flow and network activity charts identify periods of high traffic that may be associated with performance problems.
Historical analysis is useful when symptoms occur briefly or outside normal maintenance hours.
IOTA EDGE can be installed at strategic points to retain recorded traffic for subsequent review through its management interface.
This supports investigations at installations where technical personnel are not always present. Remote access must be configured in accordance with the industrial network’s security policies.
IOTA 1G+ and 10G+ models include GPS/PPS synchronisation for applications requiring comparison of events recorded on different segments.
This function helps examine the timing of communications and locate where an incident occurs. For reliable results, devices must be synchronised to an appropriate reference.
At Garma Electrónica, we help you select the device based on link speed and physical media, network topology, required capture duration and analysis requirements.
To size a solution correctly, it is important to understand expected traffic, the protocols used and whether capture will take place in-line or from a monitoring port.
Request a demonstration or tell us what you need to analyse.
Garma will help you assess the model and functions best suited to your application.
Request a Demo →You might also like